
Financial Highlights
|
2018 |
2019 |
2020 |
|
|
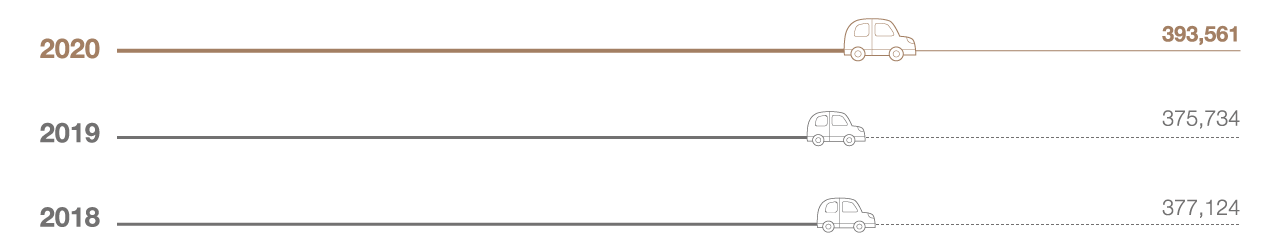
Operating revenues (RMB millions) |
377,124 |
375,734 |
393,561 |
|
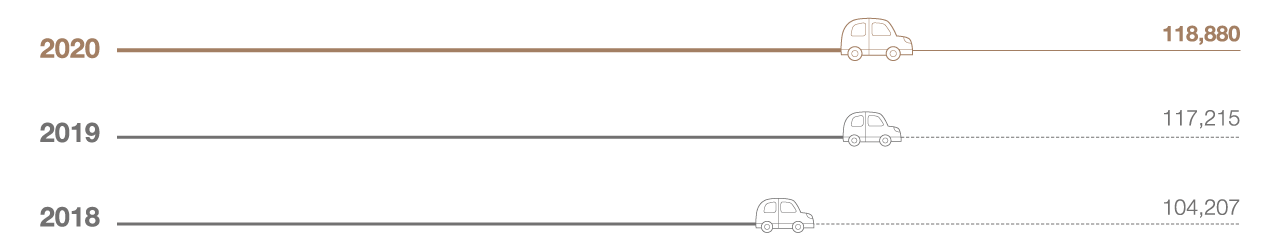
EBITDA1 (RMB millions) |
104,207 |
117,215 |
118,880 |
|
EBITDA margin2 |
29.7% |
32.8% |
31.8% |
|
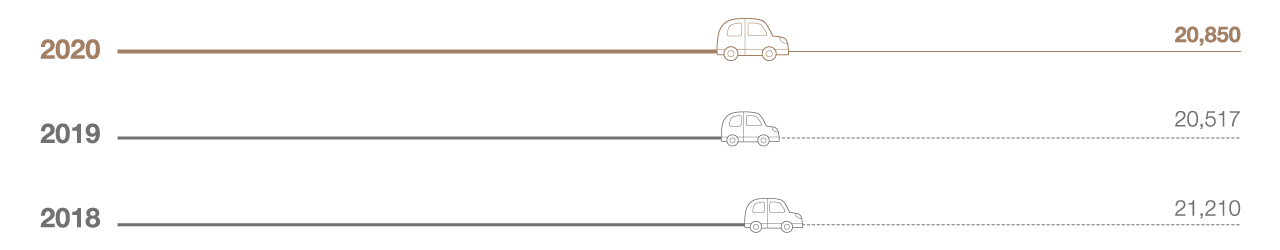
Net profit3 (RMB millions) |
21,210 |
20,517 |
20,850 |
|
Capital expenditure (RMB millions) |
74,940 |
77,557 |
84,800 |
|
Free cash flow4 (RMB millions) |
22,457 |
21,725 |
14,276 |
|
Total debt/Equity5 |
27.9% |
22.4% |
14.7% |
|
Earnings per share (RMB) |
0.2621 |
0.2535 |
0.2576 |
|
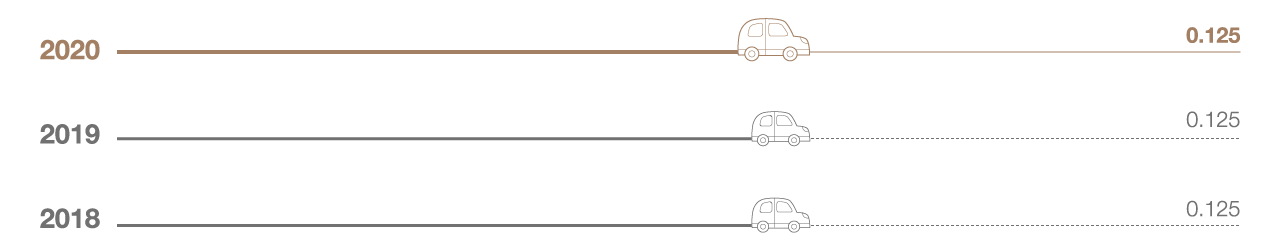
Dividend per share (HK$) |
0.125 |
0.125 |
0.125 |
1 EBITDA is calculated based on operating revenues minus operating expenses plus depreciation and amortisation.
2 EBITDA margin is calculated based on EBITDA divided by service revenues.
3 Net profit represents profit attributable to equity holders of the Company.
4 Free cash flow is calculated based on EBITDA minus capital expenditure, income tax and depreciation charge for right-of-use assets other than land-use-rights.
5 Total indebtedness refers to interest-bearing debts excluding lease liabilities. Total equity represented equity attributable to equity holders of the Company.
Forward-Looking Statements
Certain statements contained in this report may be viewed as “forward-looking statements” within the meaning of Section 27A of the U.S. Securities Act of 1933 (as amended) and Section 21E of the U.S. Securities Exchange Act of 1934 (as amended). Such forward-looking statements are subject to known and unknown risks, uncertainties and other factors, which may cause the actual performance, financial condition or results of operations of the Company to be materially different from any future performance, financial condition or results of operations implied by such forward-looking statements. In addition, we do not intend to update these forward-looking statements. Further information regarding these risks, uncertainties and other factors is included in the Company’s most recent Annual Report on Form 20-F filed with the U.S. Securities and Exchange Commission (the “SEC”) and in the Company’s other filings with the SEC.
For further information, please browse our website at www.chinatelecom-h.com

Operating Revenues
(RMB millions)
EBITDA
(RMB millions)
Net Profit
(RMB millions)
Dividend Per Share
(HK$)