


Financial Review
Management chaired the work meeting on auditing and risk control
Summary
In 2020, the Company coordinated Epidemic prevention and control with operation and development, firmly seized the opportunities emerging from the digital transformation of the economy and society, comprehensively promoted its Cloudification reform as well as digital transformation, constructed new infrastructure based on cloud-network integration, and continued to promote high-quality development. The service revenues of the Company continued to grow, and the growth rate has surpassed the industry average for many years. Meanwhile, the Company actively supported the development of 5G and Industrial Digitalisation service capabilities, continued to strengthen precision cost control, effectively improved resource utilisation effectiveness, and achieved steady growth in operating results. Operating revenues in 2020 were RMB393,561 million, representing an increase of 4.7% from year 2019; service revenues1 were RMB373,798 million, representing an increase of 4.5% from year 2019; operating expenses were RMB364,921 million, representing an increase of 5.3% from year 2019; profit attributable to equity holders of the Company was RMB20,850 million, representing an increase of 1.6% from year 2019; basic earnings per share were RMB0.26; EBITDA2 was RMB118,880 million, representing an increase of 1.4% from year 2019 and the EBITDA margin3 was 31.8%.
1 Service revenues are calculated based on operating revenues minus sales of mobile terminals (2020: RMB10,711 million; 2019: RMB9,364 million), sales of wireline equipment (2020: RMB5,430 million; 2019: RMB5,226 million), and other non-service revenues (2020: RMB3,622 million; 2019: RMB3,534 million).
2 EBITDA is calculated based on operating revenues minus operating expenses plus depreciation and amortisation. As the telecommunications business is a capital intensive industry, capital expenditure, the level of gearing and finance costs may have a significant impact on the net profit of companies with similar operating results. Therefore, we believe EBITDA may be helpful in analysing the operating results of a telecommunications service provider such as the Company. Although EBITDA has been widely applied in the global telecommunications industry as a benchmark to reflect operating performance, debt raising ability and liquidity, it is not regarded as a measure of operating performance and liquidity under generally accepted accounting principles. It also does not represent net cash from operating activities. In addition, our EBITDA may not be comparable to similar indicators provided by other companies.
3 EBITDA margin is calculated based on EBITDA divided by service revenues.
Operating Revenues
The Company captured opportunities arising from the digital transformation of the economy and society, leveraged the strengths of cloud-network service capabilities, accelerated the development of Industrial Digitalisation service, strived to promote effective scale development, and continued to maintain healthy growth in revenue and optimise the revenue structure. Operating revenues in 2020 were RMB393,561 million, representing an increase of 4.7% from year 2019. Service revenues were RMB373,798 million, representing an increase of 4.5% from year 2019, of which mobile service revenues were RMB181,687 million, representing an increase of 3.5% from year 2019, and wireline service revenues were RMB192,111 million, representing an increase of 5.5% from year 2019.
The following table sets forth a breakdown of the operating revenues for 2019 and 2020, together with their respective rates of change:
|
For the year ended |
Rates of |
||
|
(RMB millions, except percentage data) |
2020 |
2019 |
change |
|
Voice |
40,866 |
45,146 |
-9.5% |
|
Internet |
208,019 |
197,244 |
5.5% |
|
Information and application services |
96,885 |
87,623 |
10.6% |
|
Telecommunications network resource and network equipment services |
22,623 |
21,978 |
2.9% |
|
Others4 |
25,168 |
23,743 |
6.0% |
|
Total operating revenues |
393,561 |
375,734 |
4.7% |
4 Other revenues in 2020 refers to the aggregate amount of sales of goods and others, included in revenues from contracts with customers, and revenues from other sources.
Voice
In 2020, having been continuously affected by the cannibalisation of mobile Internet services such as OTT, revenue from voice services was RMB40,866 million, representing a decrease of 9.5% from year 2019 and accounting for 10.4% of operating revenues. The revenue structure was continuously optimised.
Internet
In 2020, revenue from Internet services was RMB208,019 million, representing an increase of 5.5% from year 2019, accounting for 52.9% of operating revenues. The 5G consumer service achieved a promising start, enabling the Company to achieve a valuable scale expansion in the mobile subscriber market. Mobile ARPU decline continuously narrowed, data traffic revenue maintained rapid growth, and handset Internet access revenue was RMB130,655 million, representing an increase of 6.0% from year 2019. The Company comprehensively promoted the upgrade of family informatisation services, and the value of broadband access business was reshaped. Wireline broadband revenue ceased to decline and rebounded. Wireline broadband revenue for the year was RMB71,872 million, representing an increase of 5.1% from year 2019.
Information and Application Services
In 2020, the Company sped up the integration and innovation of emerging technologies. Industrial Digitalisation service was developed at a quicker speed. Revenue from information and application services was RMB96,885 million, representing an increase of 10.6% from year 2019 and accounting for 24.6% of operating revenues which benefited from the rapid development of emerging businesses such as IDC, Industry Cloud, e-Surfing HD and Internet Finance.
Telecommunications Network Resource and Equipment Services
In 2020, revenue from telecommunications network resource and equipment services was RMB22,623 million, representing an increase of 2.9% from year 2019 and accounting for 5.7% of operating revenues. The growth was mainly due to favourable growth in revenues from cloud dedicated lines and IP-VPN service.
Others
In 2020, other revenues were RMB25,168 million, representing an increase of 6.0% from year 2019 and accounting for 6.4% of operating revenues. The increase was mainly due to the increase in the scale of mobile terminals sold.
Operating Expenses
The Company seized the opportunity of 5G scale development, accelerated digital transformation development, and continued to increase investment in government and enterprise business and research and development system. Concurrently, the Company internally strengthened the deployment of the digital platform, took various measures to continue to strengthen precision cost control, further carried out multi-dimensional subdivision, and effectively improved the effectiveness of resource utilisation. In 2020, operating expenses were RMB364,921 million, representing an increase of 5.3% from year 2019. Operating expenses accounted for 92.7% of operating revenues, representing an increase of 0.4 percentage point from year 2019.
The following table sets forth a breakdown of the operating expenses in 2019 and 2020 and their respective rates of change:
|
For the year ended |
Rates of |
||
|
(RMB millions, except percentage data) |
2020 |
2019 |
change |
|
Depreciation and amortisation |
90,240 |
88,145 |
2.4% |
|
Network operations and support |
119,517 |
109,799 |
8.9% |
|
Selling, general and administrative |
55,059 |
57,361 |
-4.0% |
|
Personnel expenses |
65,989 |
63,567 |
3.8% |
|
Other operating expenses |
29,074 |
27,792 |
4.6% |
|
Impairment loss on property, plant and equipment |
5,042 |
– |
Not Applicable |
|
Total operating expenses |
364,921 |
346,664 |
5.3% |
Depreciation and Amortisation
In 2020, depreciation and amortisation amounted to RMB90,240 million, representing an increase of 2.4% from year 2019 and accounting for 22.9% of operating revenues. The main reason for the increase was that the Company increased its capital expenditure in order to support the scale construction of 5G network and constantly strengthen its competitive advantages in network.
Network Operations and Support
In 2020, network operations and support expenses amounted to RMB119,517 million, representing an increase of 8.9% from year 2019 and accounting for 30.4% of operating revenues. The main reason for the increase was because the Company’s continuously optimisation in network quality while improving user perception, actively supporting the development of 5G and Industrial Digitalisation service, and appropriately increasing the deployment in network operation expenditures.
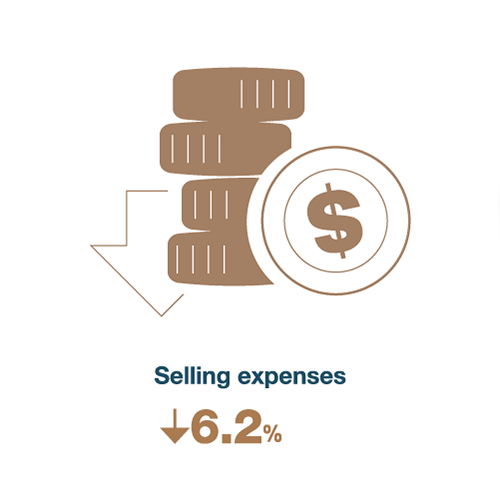
Selling, General and Administrative
In 2020, selling, general and administrative expenses amounted to RMB55,059 million, representing a decrease of 4.0% from year 2019 and accounting for 14.0% of operating revenues. Selling expenses were RMB45,447 million, representing a decrease of 6.2% from year 2019, which was mainly due to the Company seizing the development opportunities of Internet online business, accelerating the transformation of sales model and the online and offline synergistic development, as well as enhancing its big data online precision marketing capabilities and continuously improving the input efficiency of marketing resources. General and administrative expenses amounted to RMB9,612 million, representing an increase of 8.1% from year 2019, which was mainly because of the Company’s active promotion of sci-tech innovation, accelerated transformation to a sci-tech company and increase in the investment in research and development.
Personnel Expenses
In 2020, personnel expenses amounted to RMB65,989 million, representing an increase of 3.8% from year 2019 and accounting for 16.8% of operating revenues. The increase was mainly due to the Company’s continued introduction of high-tech talents and increased incentives for front-line employees and high performance team, so as to enhance employees’ vitality. Investments in personnel expenses are in line with the transformation of the Company towards a sci-tech company in the future. Details of the number of employees, remuneration policies and training programs have been included in the Environmental, Social and Governance report in this annual report.
Other Operating Expenses
In 2020, other operating expenses amounted to RMB29,074 million, representing an increase of 4.6% from year 2019 and accounting for 7.4% of operating revenues. The increase was mainly due to the increase in the scale of mobile terminals sold.
Impairment loss on property, plant and equipment
Following the network evolution and the full coverage of 4G and 5G scale deployment, the data traffic carried by the Company’s 3G network is rapidly shrinking and the cash flow from the continual use of 3G specific network assets is expected to be so small and even become negligible. In accordance with the relevant requirements of International Financial Reporting Standard, the Group conducted an impairment test on the assets such as 3G specific network assets and recognised an impairment loss of RMB5,042 million at the end of 2020.
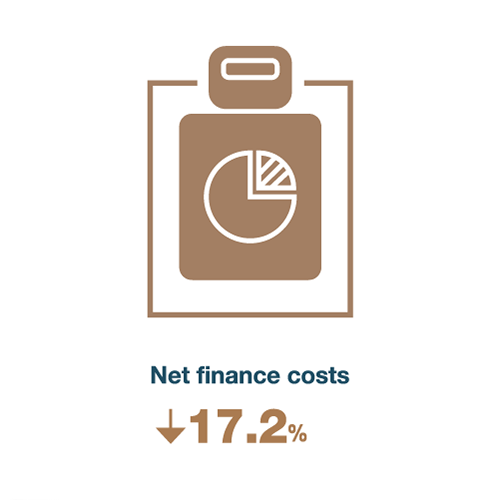
Net Finance Costs
Seizing favourable market opportunities, the Company implemented low-cost financing and reduced financing costs, continued to improve the capability of funds management, carried out sophisticated management on financing, and competently controlled the scale of indebtedness. In 2020, net finance costs amounted to RMB3,014 million, representing a decrease of 17.2% from year 2019. Net exchange loss amounted to RMB163 million in year 2020 which was mainly due to change in the exchange rate of RMB against USD.
Profitability Level
Income Tax
The Company’s statutory income tax rate is 25%. In 2020, income tax expenses were RMB6,307 million while the effective income tax rate was 23.0%. The difference between the effective income tax rate and the statutory income tax rate was mainly due to the low tax rates enjoyed by some subsidiaries and some branches located in the western region of China and the preferential tax policies enjoyed by the Company such as additional tax deduction on expenses for research and development proactively implemented by the Company. Meanwhile, income from investment in the associate company, China Tower Corporation Limited (“China Tower”), was not subject to tax during the period of the investment held.
Profit Attributable to Equity Holders of the Company
The Company closely followed the digital transformation progress of the economy and society, deepened reform and innovation, and strived to improve quality and increase efficiency. In 2020, profit attributable to equity holders of the Company was RMB20,850 million, representing an increase of 1.6% from 2019.
Capital Expenditure and Cash Flows
Capital Expenditure
In 2020, the Company continually promoted the 5G network co-building and co-sharing, sped up investment in 5G network construction, and continuously improved 5G network coverage. Meanwhile, the Company accelerated the construction of e-Surfing Cloud and IDC. In 2020, capital expenditure was RMB84,800 million, representing an increase of 9.3% from year 2019.
Cash Flows
The net increase in cash and cash equivalents for year 2020 was RMB3,076 million and the net increase in cash and cash equivalents for year 2019 was RMB4,098 million.
The following table sets forth the cash flow position in 2020 and 2019:
|
For the year ended |
||
|
(RMB millions) |
2020 |
2019 |
|
Net cash flow from operating activities |
132,260 |
112,600 |
|
Net cash flow used in investing activities |
(87,077) |
(77,214) |
|
Net cash flow used in financing activities |
(42,107) |
(31,288) |
|
Net increase in cash and cash equivalents |
3,076 |
4,098 |
In 2020, the net cash inflow from operating activities was RMB132,260 million, representing an increase of 17.5% from year 2019. This was mainly because the Company strengthened the management of accounts receivable and more subscribers applied the pre-paid method, so as to increase the net cash inflow from operating activities.
In 2020, the net cash outflow used in investing activities was RMB87,077 million, representing an increase of 12.8% from year 2019. The increase was mainly because of the increase in capital expenditure on supporting the development of 5G and Industrial Digitalisation service.
In 2020, the net cash outflow in financing activities was RMB42,107 million, representing an increase of 34.6% from year 2019. The main reason was that the Company controlled the scale of indebtedness within a reasonable level, resulting in decline in the cash inflow from loans.
Working Capital
The Company consistently upheld stable and prudent financial principles and stringent fund management policies. At the end of 2020, the working capital (total current assets minus total current liabilities) deficit was RMB187,126 million, representing a decrease in deficit of RMB4,353 million from year 2019. The liquidity of the Company continuously improved. As at 31 December 2020, the unutilised credit facilities were RMB244,326 million (2019: RMB245,847 million). Given the stable net cash inflow from operating activities and sound credit record, the Company has sufficient working capital to satisfy operational needs. At the end of 2020, cash and cash equivalents amounted to RMB23,684 million, among which cash and cash equivalents denominated in Renminbi accounted for 73.0% (2019: 78.0%).
Assets and Liabilities
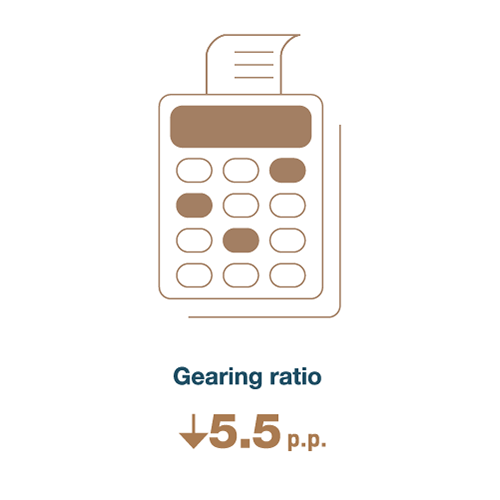
In 2020, the Company continued to maintain a solid financial position. At the end of 2020, the total assets increased by 1.7% from RMB703,131 million at the end of 2019 to RMB715,096 million. Total indebtedness5 decreased to RMB53,342 million from RMB79,022 million at the end of 2019. Gearing ratio6 decreased to 12.8% from 18.3% at the end of 2019.
5 Total indebtedness refers to interest-bearing debts excluding lease liabilities.
6 Gearing ratio is calculated based on total indebtedness divided by total capital, while total capital is calculated based on total equity attributable to equity holders of the Company plus total indebtedness.
Indebtedness
The indebtedness analysis as at the end of 2020 and 2019 is as follows:
|
For the year ended |
||
|
(RMB millions) |
2020 |
2019 |
|
Short-term debt |
27,994 |
42,527 |
|
Long-term debt maturing within one year |
1,126 |
4,444 |
|
Long-term debt |
24,222 |
32,051 |
|
Total indebtedness |
53,342 |
79,022 |
As of the end of 2020, the total indebtedness was RMB53,342 million, representing a decrease of RMB25,680 million from the end of 2019, which was mainly due to the continuous enhancement of funds management, improving the centralised funds management and appropriately controlling the scale of indebtedness. Of the total indebtedness, loans denominated in Renminbi, US Dollars and Euro accounted for 99.3% (2019: 99.4%), 0.4% (2019: 0.4%) and 0.3% (2019: 0.2%), respectively. 90.1% (2019: 82.9%) of the indebtedness are loans with fixed interest rates while the remaining portion of the indebtedness represented loans with floating interest rates.
As at 31 December 2020, neither the Company nor any of its subsidiaries pledged any assets as collateral for debt (2019: Nil).
Most of the revenues received and expenses paid in the course of our business were denominated in Renminbi, therefore there were no significant risk exposures arising from foreign exchange fluctuations.
Significant Investment
As at 31 December 2020, the Company’s external investments included interests in associates and equity instruments at fair value through other comprehensive income, with carrying amounts of RMB40,303 million and RMB1,073 million, respectively. The Company’s investment in China Tower, an associate of the Company, constituted its significant investment. Details of such investment are set out below:
|
Company name |
Stock code |
Principal businesses |
Place of incorporation |
Investment cost |
Number of shares held |
Percentage of shares held |
Carrying amount |
Fair value |
Size of fair value relative to total assets |
|
|
|
|
|
(RMB millions) |
|
|
(RMB millions) |
(RMB millions) |
of the Group |
|
China Tower |
0788.HK |
Include the tower business and indoor Distributed Antenna System (DAS) business for telecommunications industry, and the Trans-sector Site Application and Information (TSSAI) business and energy operation business for customers from various industries across wider society |
China |
36,087 |
36,087,147,592 |
20.50% |
37,463 |
34,625 |
4.8% |
As at 31 December 2020, the carrying amount of the Group’s interests in China Tower, an associate of the Company, was RMB37,463 million, accounting for 5.2% of the Group’s total assets. In 2020, share of unrealised profits of China Tower recognised by the Company amounted to RMB1,466 million, and dividends received amounted to RMB525 million. In the future, the Company can enjoy more fundamental network resources through China Tower. As one of the shareholders of China Tower, it is expected that the Company can benefit from the long-term enhancement of profits and values from China Tower.
Contractual Obligations
Contractual obligations as at 31 December 2020 are as follows:
|
(RMB millions) |
Total |
Within |
Between |
Between |
Thereafter |
|
Short-term debt |
28,417 |
28,417 |
– |
– |
– |
|
Long-term debt |
27,805 |
1,410 |
17,838 |
5,609 |
2,948 |
|
Lease liabilities |
43,896 |
14,449 |
13,363 |
12,110 |
3,974 |
|
Capital commitments |
20,199 |
20,199 |
– |
– |
– |
|
Total contractual obligations |
120,317 |
64,475 |
31,201 |
17,719 |
6,922 |
Note: Amounts of short-term debt, long-term debt and lease liabilities include recognised and unrecognised interest payable, and are not discounted.